Average Rent in Newburyport, MA
Apartments & Houses by Size
See what properties are renting for on your street
Go beyond area averages and get accurate rent estimates for any address.
Current rent in Newburyport (all property types)
- $2,366 Studio
- $2,597 1 Bedroom
- $4,123 2 Bedroom
- $4,132 3 Bedroom
Newburyport’s rental market offers a blend of historic charm and modern convenience, making it a sought‑after destination for renters seeking both character and accessibility. The city’s compact downtown, anchored by the iconic Custom House Maritime Museum and vibrant Riverwalk, provides easy access to boutique shops, acclaimed restaurants, and scenic waterfront trails. Neighborhoods such as the Riverway and the West End deliver a mix of quiet, tree‑lined streets and lively community events, appealing to professionals, families, and students alike.
Apartment options in Newburyport cater to a range of lifestyle needs. Studio units typically rent in the $2300s, while one‑bedroom apartments fall within the $2300 to $2500 range. For those needing extra space, two‑bedroom homes command mid‑$3300s to $3500s, and three‑bedroom units are generally priced around $4100. In addition to apartments, the market includes single‑family homes, providing renters with a variety of housing styles from historic brick homes to contemporary new builds.
The city’s strong rental appeal is reinforced by its proximity to top‑rated schools, commuter rail service to Boston, and a thriving arts scene highlighted by annual festivals and local galleries. Outdoor enthusiasts enjoy easy access to the Great Marsh, sailing clubs, and well‑maintained bike paths. Whether you’re drawn by the historic waterfront ambiance or the modern amenities, Newburyport delivers a vibrant, well‑rounded rental experience that balances affordability with quality of life.
Newburyport Rent by Property Type & Bedroom Count
Averages, medians, and ranges across recent rental listings
Overall average rents for this area are always free — see the summary just below.
Current rent in Newburyport (all property types)
- $2,366 Studio
- $2,597 1 Bedroom
- $4,123 2 Bedroom
- $4,132 3 Bedroom
Note: This analysis includes only bedroom types with sufficient data.
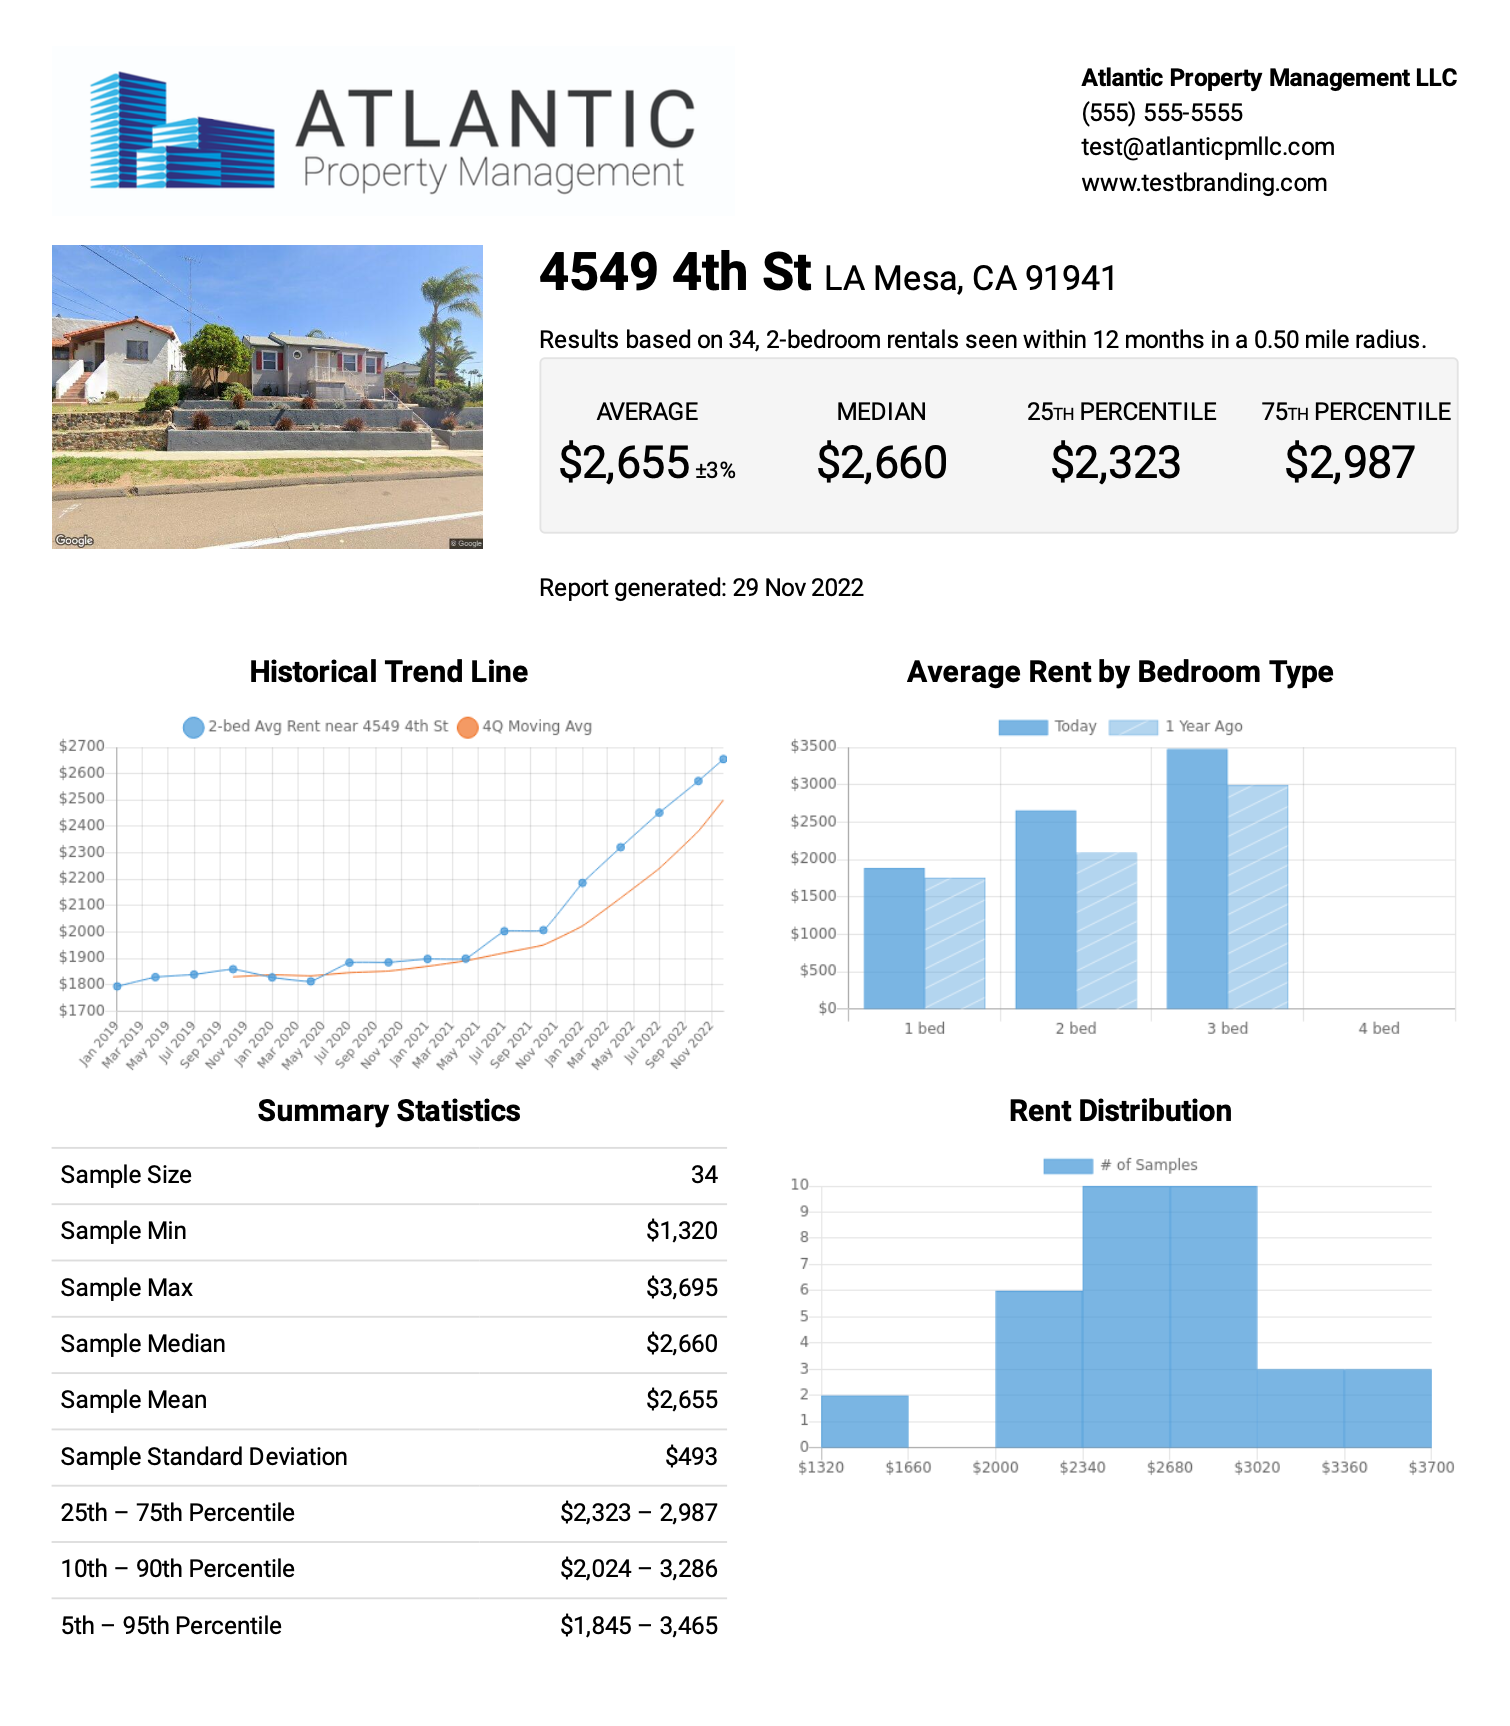
About this data
Rent statistics, listings analysis, and visualizations on this page are produced by Rentometer, Inc.
If you cite, share, or republish data from this report, please credit Rentometer.